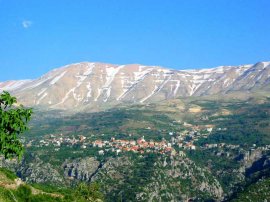


In Zgharta
Demographic Studies relating to North Lebanon & Zgharta Zawie
Population distribution according to age and gender in Zgharta Zawie.
[Statistics extracted from Ministry of Social Affairs Study 2002 and zgharta.com]
|
Age |
Male |
Female |
Total |
|||||
|
|
Number |
% |
Number |
% |
Number |
% |
||
|
0-14 |
6861 |
29.18 |
7003 |
27.51 |
13865 |
28.31 |
||
|
15-29 |
6658 |
28.21 |
6597 |
25.92 |
13256 |
27.07 |
||
|
30-64 |
8069 |
34.31 |
9805 |
38.52 |
17874 |
36.5 |
||
|
65-79 |
1533 |
6.52 |
1705 |
6.7 |
3238 |
6.61 |
||
|
80+ |
396 |
1.68 |
335 |
1.32 |
731 |
1.49 |
||
|
No answ |
0 |
0 |
10 |
0.04 |
10 |
0.02 |
|
|
|
Total |
23518 |
1 |
25456 |
1 |
48974 |
1 |
||
Conclusions:
above 55% are under 30 years old
around 34% are between 34 and 80 years old
and a very small portion is more than 80 years of age


 Pierre Douaihy